System Health Event Monitor Event Monitor Reference Guide
Monitors key health values for servers and workstations.
Overview
The System Health Event Monitor collects comprehensive data across several key performance indicators including CPU, memory, disk, bandwidth, and ping response time. It is designed to allow users to set and manage alert thresholds for each metric effectively, providing an integrated view via the system health dashboard and detailed reports.
Use Cases
- Initial Setup: Starting with PIM+ for setting up your first event monitor.
- Comprehensive Monitoring: Monitoring multiple metrics across various systems simultaneously.
- Efficiency: Reducing the total number of event monitors needed by leveraging comprehensive key metric monitoring.
Monitoring Options
This event monitor provides the following options:
Connectivity Alerts
- Device Contact: Alert with levels [Info/Warning/Error/Critical] if PIM+ cannot contact the device.
Performance Alerts
- CPU Usage: Alerts when CPU usage exceeds specified thresholds.
- Memory Usage: Alerts based on the percentage of memory used.
- Disk Usage: Alerts when disk or partition space is low. Option to exclude specific drives like
"deviceName(C)". - Directory File Count: Alert if directory contains [more than / less than] a specified number of files.
Network Alerts
- Ping Response Times: Alerts based on the ping response times.
- Bandwidth Rates:
- Total Bandwidth: Alerts based on the total bandwidth usage.
- Outgoing Bandwidth: Alerts for combined outgoing bandwidth rate.
- Incoming Bandwidth: Alerts for combined incoming bandwidth rate.
Additional Settings
- SSH Port Number: Default is 22. Specify if using a non-standard port.
Authentication and Security
Ensure proper user credentials and group memberships for reliable and secure data collection:
- PDH: Requires Performance Monitor Users group membership or admin rights.
- WMI: Requires membership in both the Performance Monitor Users and Distributed COM Users groups, or admin rights.
- SSH: User must have permissions to run system commands like
df,netstat,sysctl. - SNMP:
- SNMPv1 and SNMPv2c: Requires a community string.
- SNMPv3: Requires a username and additional SNMPv3 parameters.
Protocols
Configure the event monitor to use one of these protocols based on your environment:
Data Points
This event monitor generates various data points, including but not limited to:
| Data Point | Description |
|---|---|
| Average Respons Time | The calculated average ping reponse time |
| CPU Usage | The total CPU used, by percent |
| Used Memory | The percentage of total memory used |
| Space used C; | THe percentage of space used in the C drive |
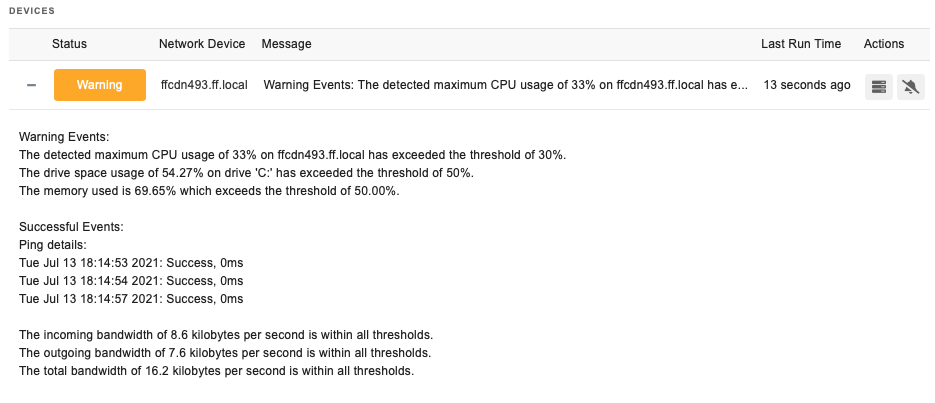
Sample Output
Detailed in a separate section or document as needed