PowerShell Script Event Monitor Reference Guide
Overview
The PowerShell Script Event Monitor is a scripting tool provided by PIM+ that allows for the integration of custom PowerShell scripts into the monitoring framework. This monitor can execute PowerShell scripts that perform specific checks, generate status messages, and create graph data points for in-depth monitoring insights.
It lets you write custom monitoring actions using Windows PowerShell and integrate them fully into the PIM+ monitoring and notification engine. A sample script is provided to help you get started.
Use Cases
- Custom Script Execution: Execute custom PowerShell scripts for specialized monitoring tasks.
- Integration and Automation: Automate complex sequences of operations that interact with various system components and services.
Getting Started
First, create a new PowerShell event monitor and select the network devices you would like to monitor.
The event monitor includes a built-in code editor with syntax highlighting specifically designed for PowerShell scripting. A sample script is provided that triggers a randomized alert to help you get started and understand how scripts are structured.
The sample script will trigger a randomized alert each time it runs. The code is useful when used as an example to create your own unique script.
Monitoring Options
This event monitor provides the following options:
Version
- PowerShell Version: Choose between PowerShell 5 or PowerShell 7 and later, depending on script compatibility and requirements.
Script
-
Input: Paste your PowerShell script into the designated area within the event monitor's settings. The script runs on the PIM+ system, and must include any network interactions explicitly.
-
Execution Context: The script executes either on the PIM+ main console or a remote node. If your script needs to perform actions on network devices, you'll need to connect explicitly and use credentials when necessary.
Script Tokens
Your script can utilize tokens replaced by PIM+ at runtime:
| Token | Description |
|---|---|
%%devicename%% | The name of the device that generated the event. |
%%displayname%% | Display name of the device or device name if no display name is set. |
%%devicegroup%% | The group name the device resides in. |
%%deviceusername%% | Username from the device's authentication profile. |
%%devicepassword%% | Password from the device's authentication profile. |
%%devicetag=xyz%% | Value of a specified device tag, e.g., %%devicetag=contactname%%. |
%%ipaddress%% | The IP address of the device that generated the event. |
%%monitortag=xyz%% | Value of a specified monitor tag, e.g., %%monitortag=location%%. |
Tip: You can use <br /> tags in your output to format multi-line text into notifications.
Script Output Requirements
Scripts must output their status in a specific format recognized by PIM+.
Status(devicename)=Event message
Where Status is one of:
SuccessInfoWarningErrorCritical
Output Examples
Your script can perform any type of check that you want. The only requirement is that it produces output in a specific format that PIM+ expects.
The expected format is:
Success(www.pim+.com)=Successfully verified page content on the website.
In the above example, "Status" must be one of "Success", "Info", "Warning", "Error", or "Critical", indicating the status level for the alert. The value "devicename" is the device name to associate the event with. The %%devicename%% token is typically used to populate this field. The value "Event message" is the complete text that you want to include in the generated event.
Here is a complete example of valid output for a script:
Warning(n05.PIM.local)=The average CPU usage has exceeded 80%.
The output must be all on one single line. To format event text with multiple lines, use standard HTML <br> tags, as shown in the following example:
Info(n22.PIM.local)=Line 1<br />Line 2<br />Line3<br />
Event Status Levels
Scripts can generate various event statuses:
- Success(hostname) = All checks completed successfully.
- Info(hostname) = Informational notification.
- Warning(hostname) = Warning about a potential issue.
- Error(hostname) = Significant problem detected.
- Critical(hostname) = Severe failure detected.
Data Points
Besides generating status messages, your script can create graph data points used in dashboards, graphs, and reports in the PIM+ interface.
The required output format:
DataPoint(%%devicename%%)=data-type|data-name|data-label|data-value|status-level
Data Point Output Examples
DataPoint(n37.PIM.local)=6|cpu|CPU Usage|55.8|Warning
DataPoint(n37.PIM.local)=4|diskc|Disk Usage C:|81.6|Info
DataPoint(n37.PIM.local)=11|bandwidth|Bandwidth eth0|98213892|Info
Data Point Field Explanation
- data-type: Numeric type indicator (see table below).
- data-name: Short machine-readable name.
- data-label: User-friendly label for the UI.
- data-value: Numeric value.
- status-level: Event status (Success, Info, Warning, Error, Critical).
Supported Data Types
| Type | Description |
|---|---|
| 0 | Milliseconds |
| 1 | Integer |
| 2 | Floating-point value |
| 3 | Success/Failure (1 or 0) |
| 4 | File size in bytes |
| 5 | Bandwidth in bytes/second |
| 6 | Percentage |
| 7 | Rate per second |
| 8 | Date in seconds (Unix time) |
| 9 | Time span in seconds |
| 10 | String value |
| 11 | Bandwidth in bits/second |
| 12 | Temperature in Fahrenheit |
| 13 | Temperature in Celsius |
| 14 | Watts |
Authentication and Security
- Authentication Profiles: Normally select "-- None --".
- Using Tokens: Use
%%deviceusername%%and%%devicepassword%%for in-script authentication. - Special Cases: If necessary, consult PIM+ support for complex authentication scenarios.
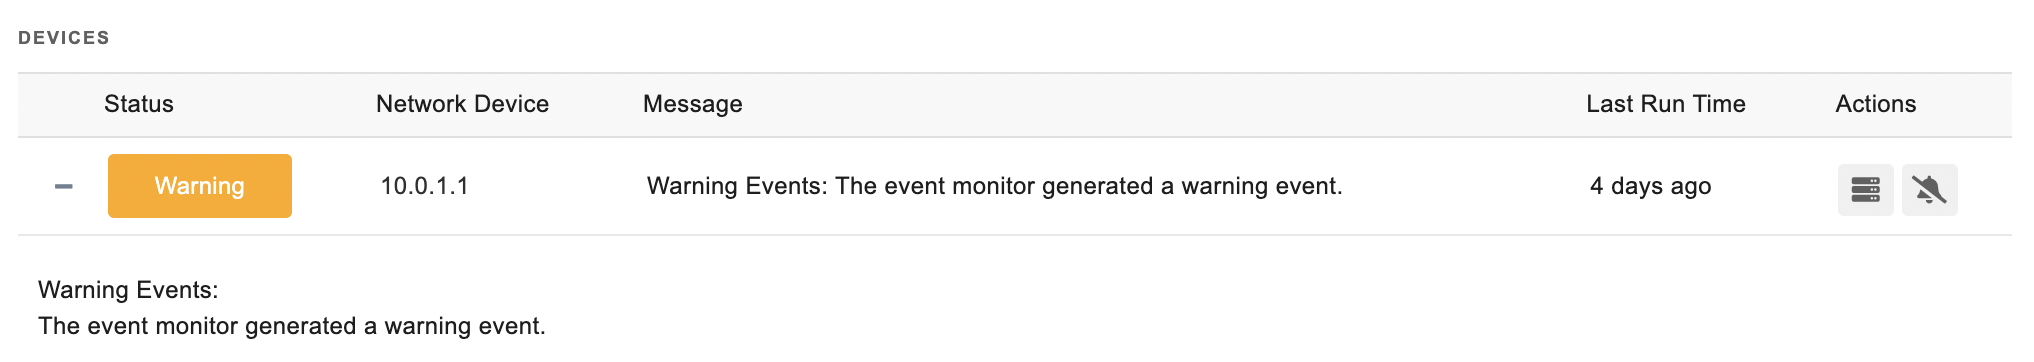
Sample Output
Sample Scripts
PIM+ includes several ready-made PowerShell Event Monitor scripts. Access these via the "Add Event Monitor" menu and customize them for your needs.
Summary
The PowerShell Script Event Monitor provides a flexible and powerful extension to PIM+'s monitoring capabilities. With just a bit of PowerShell scripting, you can automate checks, monitor unique conditions, and visualize critical metrics.
Need help writing scripts? Contact the PIM+ support team or browse our Features section for new tutorials!