ODBC Event Monitor Reference Guide
notitie
Overview
The ODBC Event Monitor leverages Open Database Connectivity (ODBC) to interface with various databases, providing functionality to execute SQL statements, monitor database responsiveness, and alert based on specific data retrieved from the database. This tool is essential for ensuring the health and performance of databases that have an available ODBC driver.
info
Before You Start
Ensure that the appropriate ODBC driver for your database is installed. PIM+'s monitoring engine is 64-bit, requiring the 64-bit version of the database driver.
Use Cases
- Executing and verifying results from SQL statements on databases via ODBC.
- Monitoring the execution time of SQL queries to gauge database performance.
Monitoring Options
Configuration
- ODBC Data Source Name (DSN): Define a System DSN using the ODBC Data Source Administrator tool on Windows. This DSN should contain all necessary connection details.
waarschuwing
Alerts
- Alert if the database cannot be contacted: Configure to notify if there are connectivity issues, which could be due to several reasons including database downtime or network issues.
- Run a SQL statement: Option to execute a SQL command or stored procedure, with settings to validate and interpret the results.
- SQL Statement to Run: Enter the SQL command or stored procedure to be executed by the event monitor.
- Show the first [#] result rows in notifications: Include the initial rows of results in the alert notifications to provide immediate insight.
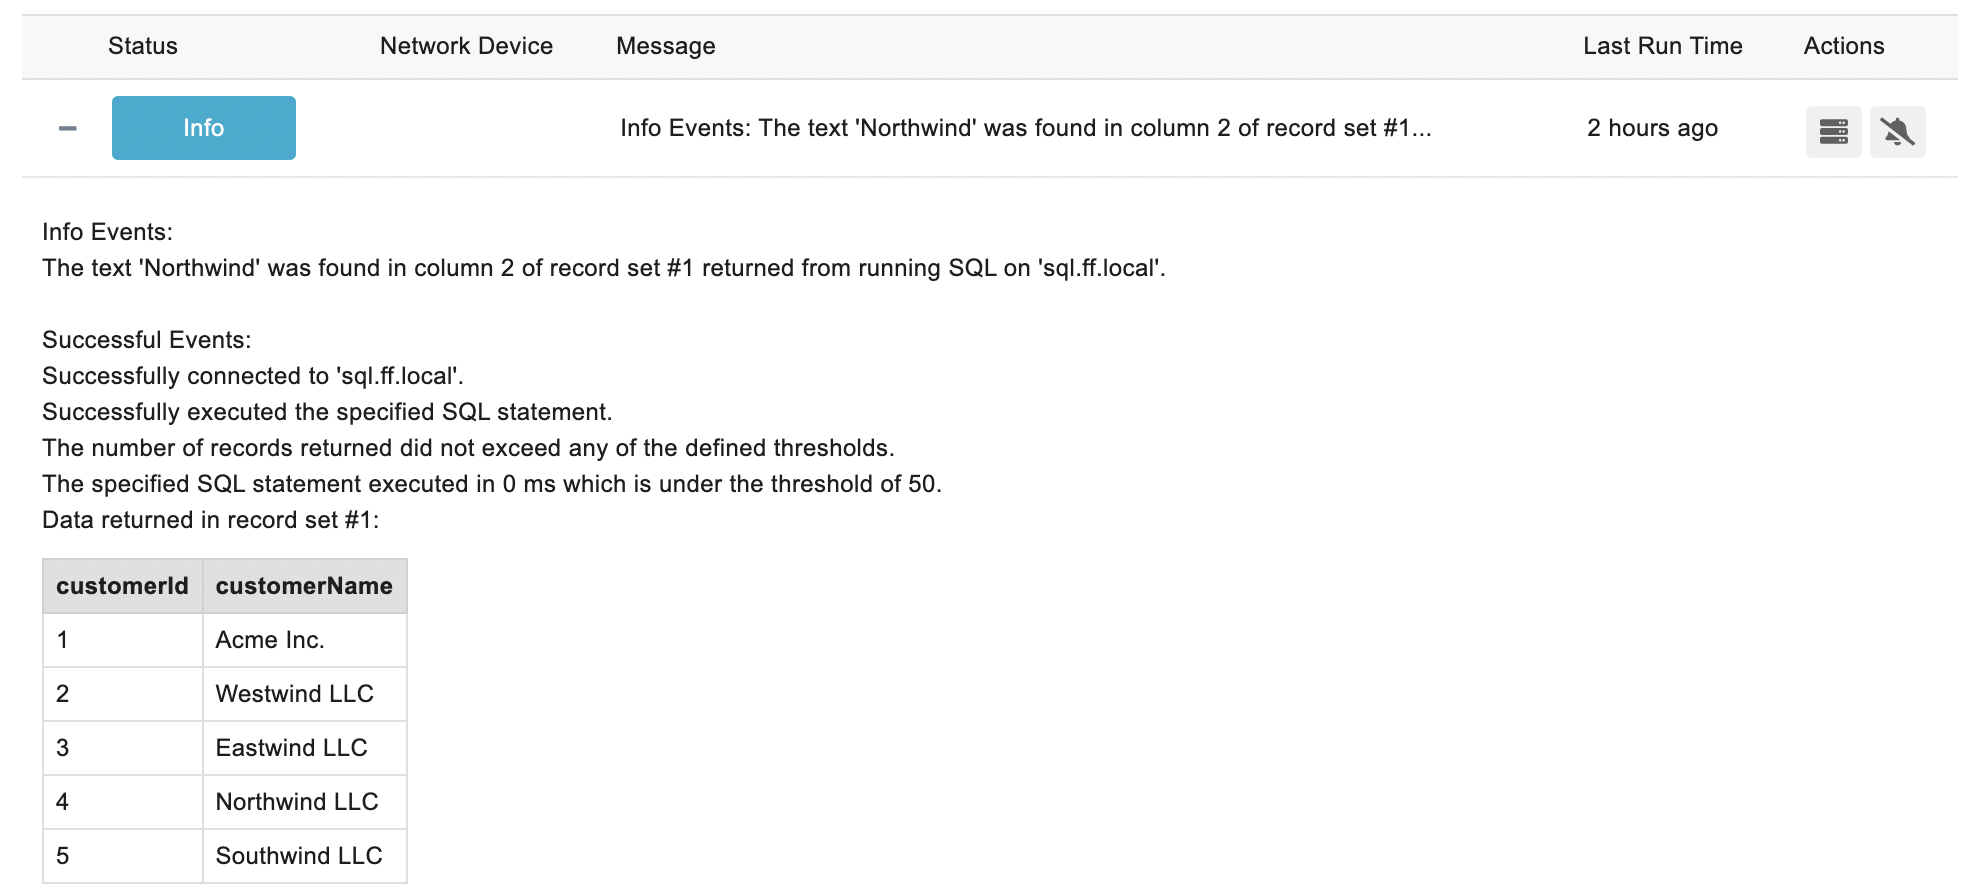
- Alert based on text found in results: Set up alerts to trigger when specific text is detected in the query results.
Search and Validation
- Search Text: Specify the text to search for within the SQL query results.
- Number of Rows to Check: Determine how many rows from the result set should be checked for the specified text.
- Column Number to Check: Identify which column should be searched for the specified text.
Device Association
- Device Association: Link the results and events to a specific real or virtual device within your monitoring setup. This facilitates integration into dashboards, reports, and other analytical tools.
Authentication and Security
- Authentication Profile: Choose a profile that contains credentials authorized to access the monitored database.
Protocols
Data Points
- This event monitor generates the following data points:
| Data Point | Description |
|---|---|
| Statement Exec Time | The time it takes to run your SQL statement. |
notitie
Note that this event monitor can also generate custom data points based on the results of your SQL queries.
Sample Output
