SQL Server Performance Event Monitor Reference Guide
notitie
Overview
The SQL Server Performance Event Monitor is designed to focus on operational metrics for SQL Server databases. This monitor is equipped with options to observe crucial performance counters such as transactions per second, average lock wait time, page lookups per second, and current user connections. It is ideal for administrators who need to ensure optimal performance and handle capacity planning.
info
Use Cases
- Monitoring and alerting on key SQL Server performance metrics.
- Understanding and optimizing transaction speeds and lock wait times.
- Managing database load and user connections effectively.
Monitoring Options
This event monitor provides the following options:
Performance Counters
- Page Lookups/sec: Monitors the rate at which pages are looked up in the buffer pool. Alerts can be set based on activity levels.
- Page Reads/sec: Tracks physical page reads across all databases, helping identify potential memory shortages.
- Page Writes/sec: Observes the rate of page writes, indicating buffer fullness and potential need for additional memory.
- Active Transactions: Monitors the number of active transactions, providing insights into transaction completion times.
- Transactions/sec: Keeps track of the transactions started and completed per second, giving a clear view of database activity levels.
- Logins/sec and Logouts/sec: Measures login and logout rates, which can indicate the efficiency of connection handling and potential traffic spikes.
- User Connections: Counts current open connections, with spikes indicating possible increased loads.
- Average Wait Time (ms): This counter measures the average wait time for locks, helping identify delays in data processing.
- Number of Deadlocks/sec: Alerts on deadlock occurrences which can severely impact database performance.
- SQL Compilations/sec and Re-Compilations/sec: Tracks the rate of SQL compilations and re-compilations, indicating the efficiency of stored procedures and potential optimization needs.
Configuration Options
- Instance Name: Specifies the SQL Server instance to connect to. Leave blank for default instances.
- Threshold Settings: Set alert thresholds for each counter to manage performance alerts effectively.
- Display Options: Choose to show graph data points for long-term performance analysis.
Advanced Settings
- Connection Settings for SQL Server Availability Group Listeners: Optimize connection settings for high availability environments.
- Ignore Offline Databases: Avoids monitoring databases that are intentionally offline to reduce unnecessary alerts.
Authentication and Security
Ensure that the monitoring account has appropriate permissions, typically requiring membership in the Performance Monitor Users group or administrative rights to access SQL Server performance counters.
Protocols
Data Points
- The performance counters you choose will appear as data points in the data point chooser
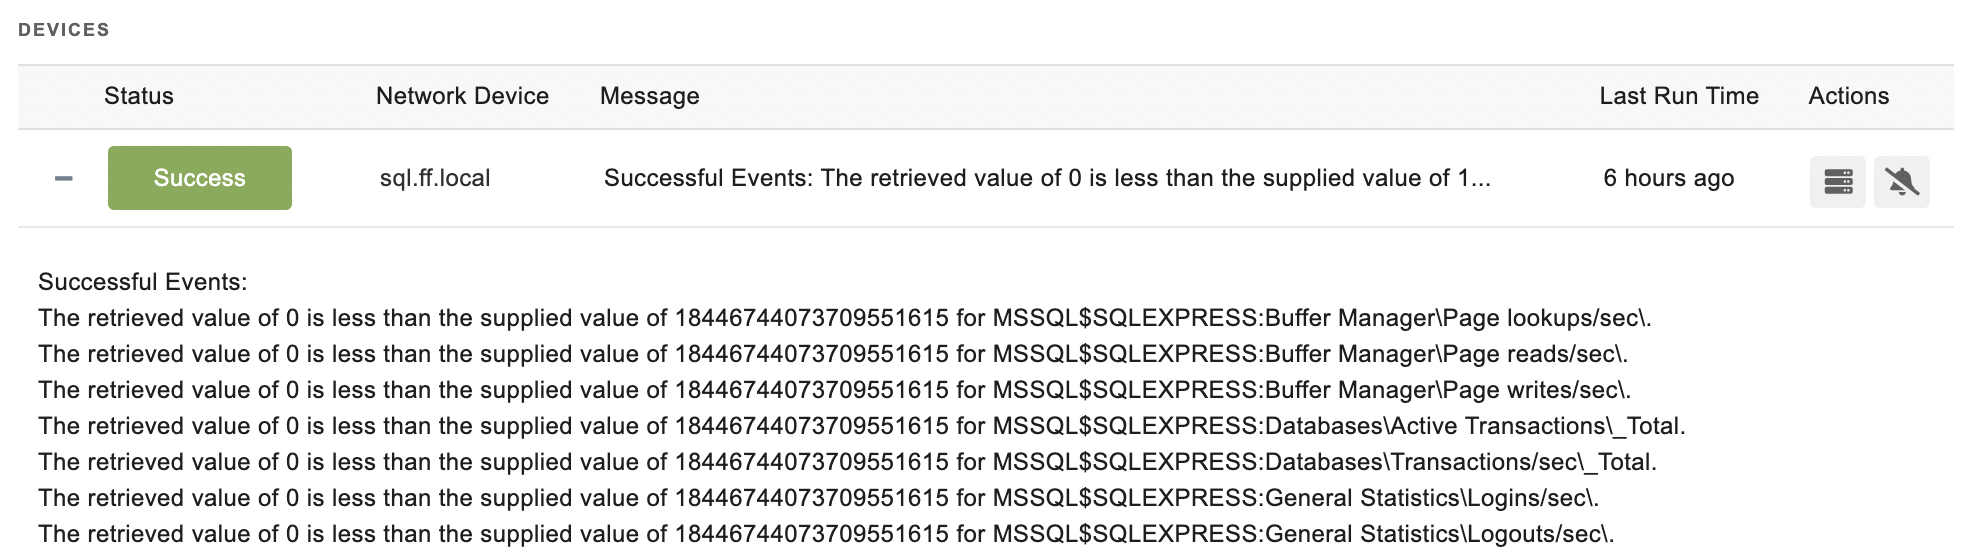
Sample Output