Installation Health Event Monitor Reference Guide
The Installation Health Event Monitor checks the overall health of the system where PIM+ is installed.
notitie
Overview
The Installation Health Event Monitor watches the health of the system where your PIM+ instance is running. It can check system health metrics like disk, ping, CPU, and bandwidth. It can also alert on monitoring actions that are taking excessive time. This monitor is recommended for your main console and, in multi-site configurations, for all remote nodes.
info
Use Cases
- Maintaining the health of your PIM+ installation
- Alerting about monitoring actions that take longer than expected to complete
Monitoring Options
This event monitor provides the following options:
- Alert with [Info/Warning/Error/Critical] if monitoring queue items take a long time to complete: Receive alerts when any item in your monitoring queue takes longer than usual to complete.
- Alert with [Info/Warning/Error/Critical] if the update service is not running (remote node only): Alert if the update service for your remote nodes is found to be stopped.
- Alert with [Info/Warning/Error/Critical] if posting data to the master console takes too long to complete (remote node only): Receive an alert if posting to your master console takes too long.
- Alert based on the percentage of memory used: Receive alerts on used memory.
- Alert based on the percentage of disk space available: Alert based on the percentage of disk space still available.
- Drives to ignore: Enter the names of the drives to ignore, separated by commas (e.g. "C, D").
- Alert if the average CPU usage is greater than a specified percentage: Trigger alerts based on exceeded CPU usage percentages.
- Alert if the average CPU usage on an individual core is greater than a specified percentage: Alert if the CPU usage on a single core exceeds the specified percentages.
- Alert if the incoming bandwidth on any interface exceeds a specified rate: Receive notification if the incoming bandwidth on any single interface exceeds the rates you specify.
- Alert if the outgoing bandwidth on any interface exceeds a specified rate: Receive notification if the outgoing bandwidth on a single interface exceeds a specified rate.
- Alert if the total bandwidth on any interface exceeds a specified rate: Alert if the total bandwidth on any interface exceeds a specified rate.
- Interfaces to ignore: Enter the names of the interfaces to ignore, separated by commas (e.g. "Realtek,Marvell").
Authentication and Security
This event monitor does not require authentication.
Protocols
Data Points
| Data Point | Description |
|---|---|
| CPU Usage | Detected CPU usage in percentage. |
| Incoming/Outgoing/Total Bandwidth | Detected bandwidth rates. |
| Number of Checks in Progress | The number of checks occurring at the time the event monitor ran. |
| Number of Checks Pending | The number of pending checks detected when the event monitor ran. |
| Space Available | The amount of space left available. |
| Used Memory % | The amount of memory currently used, expressed as a percent. |
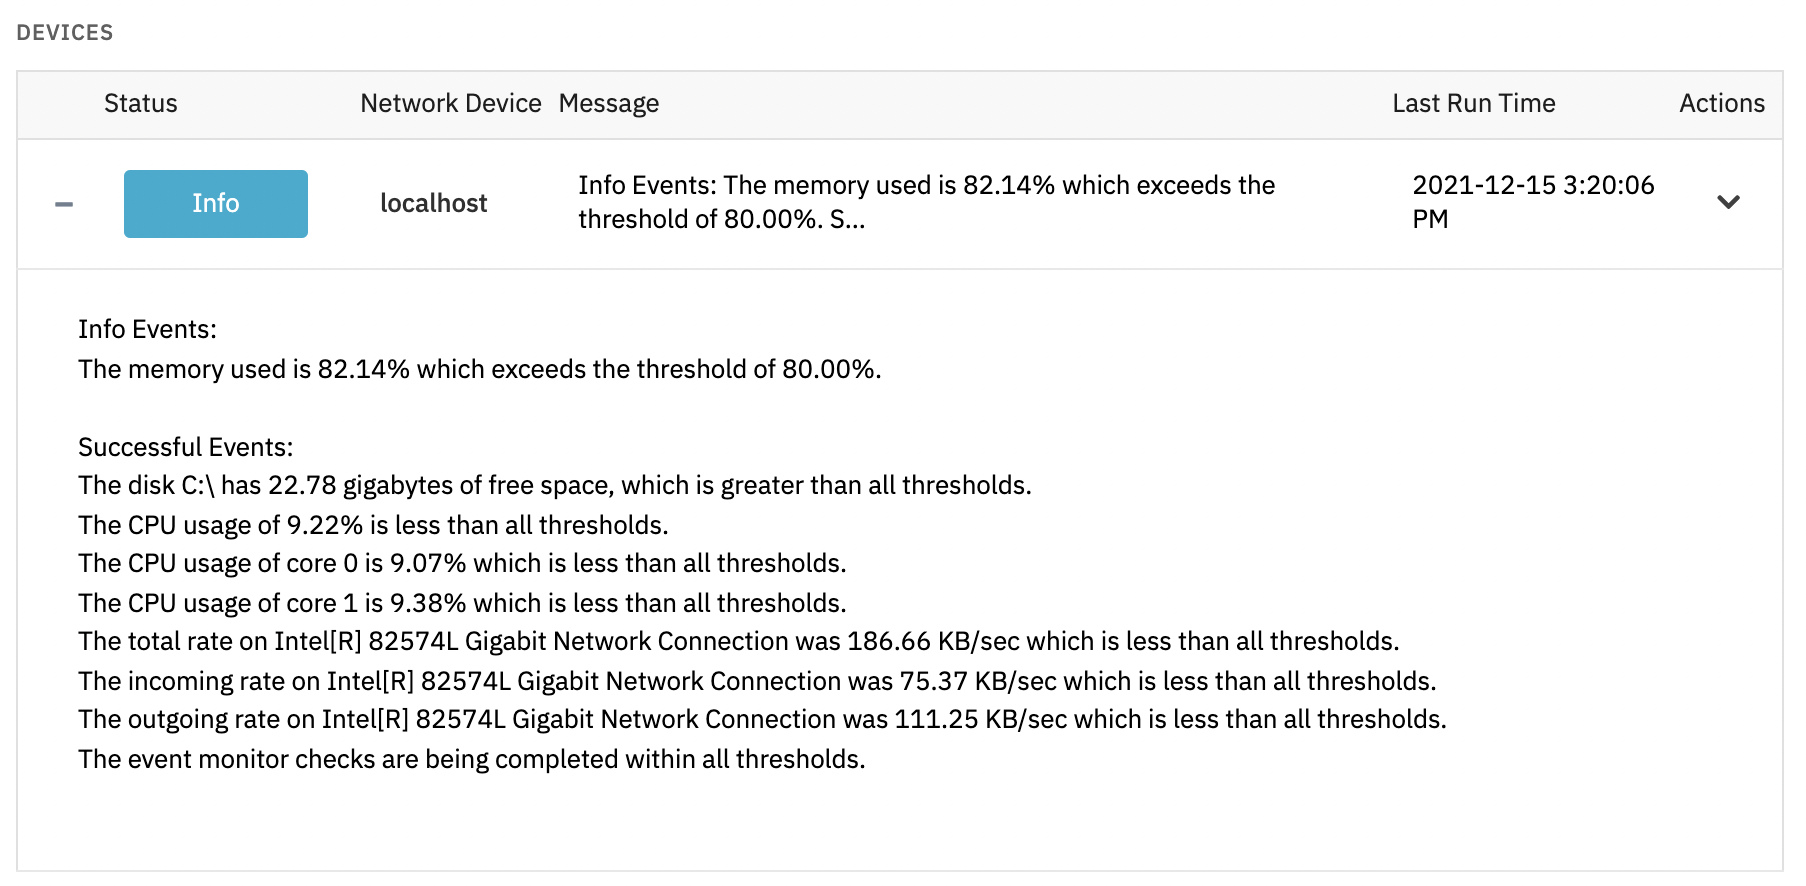
Sample Output